Your desk looks bright — but is it evenly lit?
Most lighting problems don’t look like problems. They feel like eye strain, headaches, or “something just feels off.”
AH-300 reveals what your eyes can’t see: hotspots, dark corners, and blue-light levels — in seconds.
What you can’t see with your eyes
A setup can look “bright enough” and still cause discomfort, uneven coverage, or inconsistent results. One measurement point often hides the real problem.
Looks bright → Actually uneven
Hotspots and dark corners are common—even with expensive lamps.
Feels harsh → Blue light may be higher than expected
Comfort isn’t just brightness. Blue-light levels can change with different lamps and settings.
Video looks fine → Footage reveals problems later
Uneven light often shows up only after you review the shot.
One point reading → Misses the pattern
Distribution matters. Mapping is what turns “guessing” into improvement.
AH-300 turns lighting guesswork into clear data
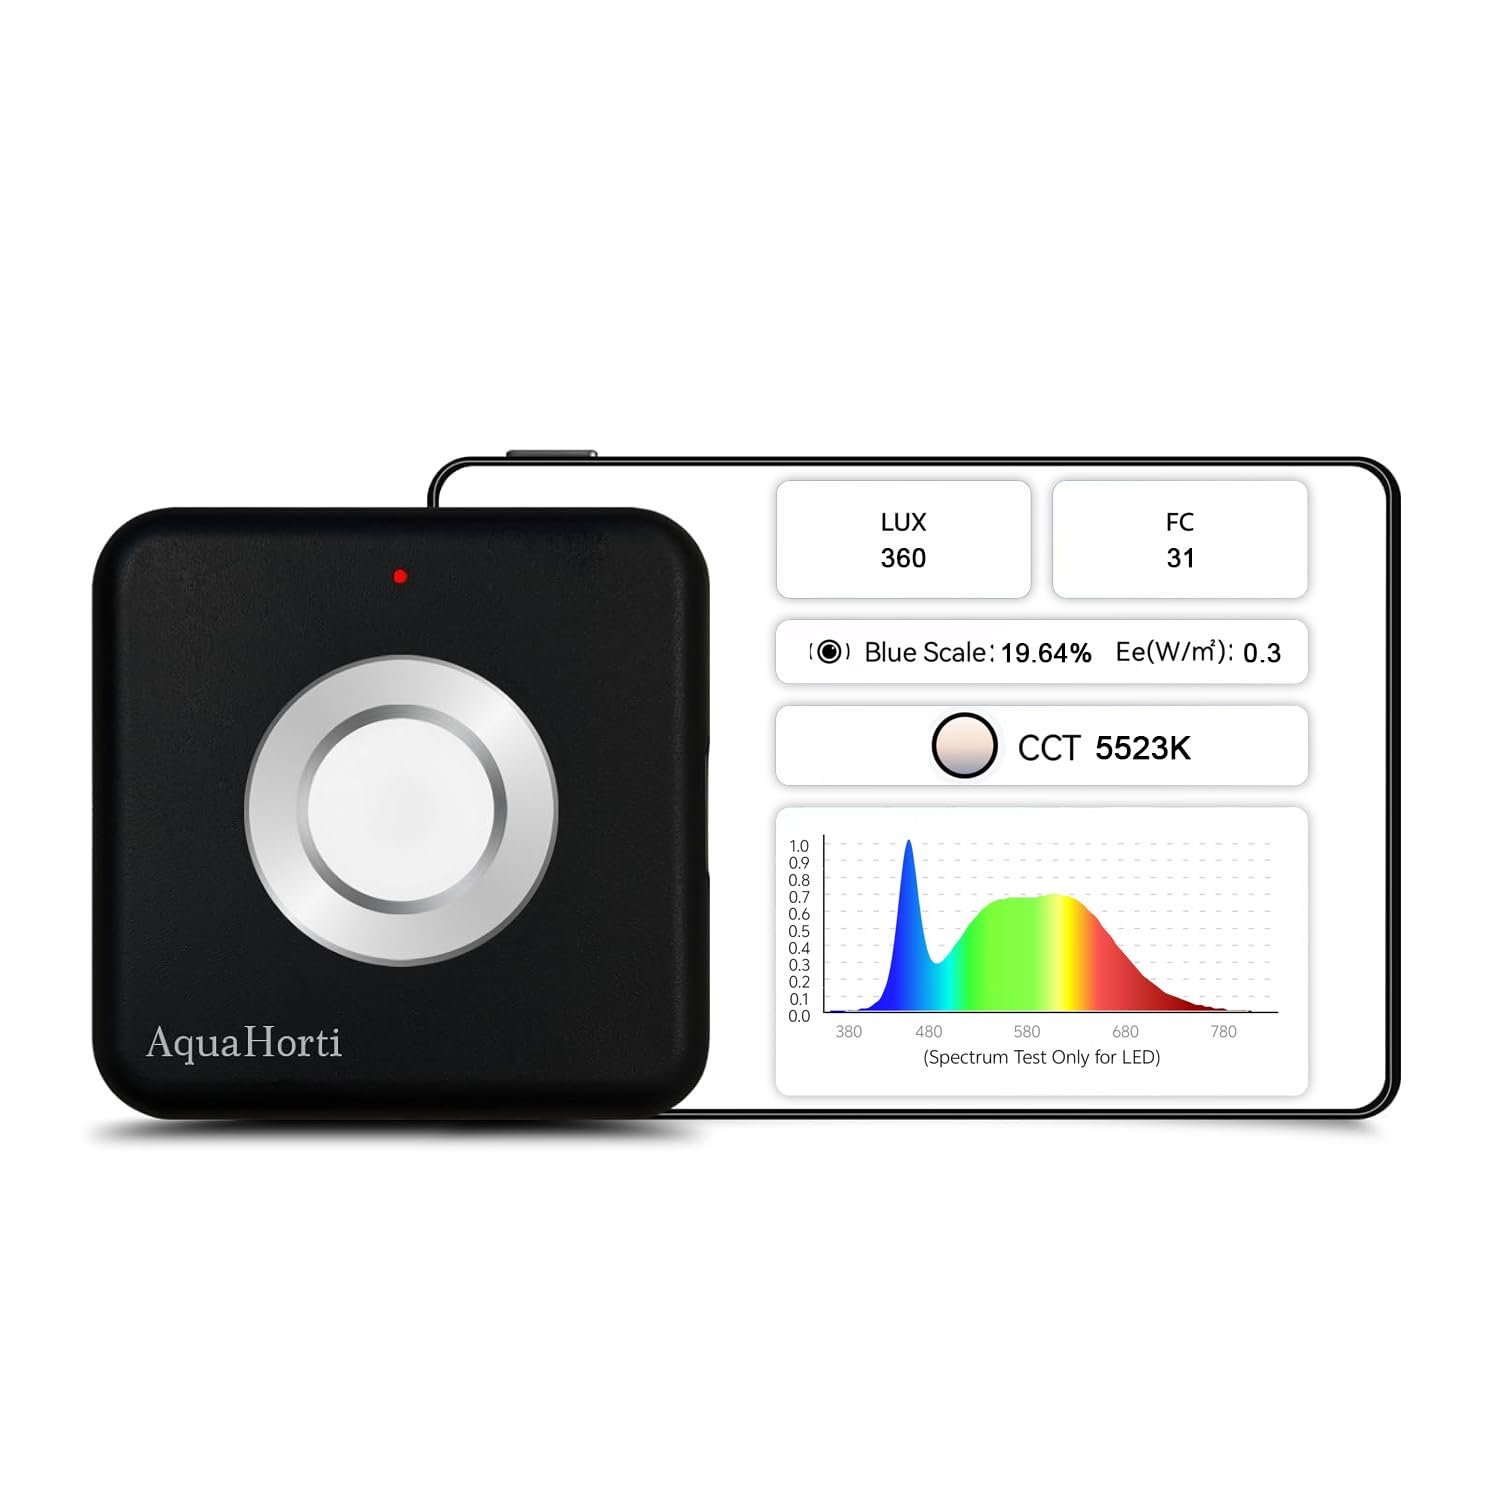
Measure illuminance and color temperature, check blue-light metrics, map lux distribution, then export everything as CSV for comparison and documentation.
Find uneven lighting — fast
See hotspots and dark zones instead of trusting a single point.
Understand blue-light exposure
Track blue-light intensity (W/m²) and percentage for desk/office setups.
Compare setups with confidence
Test different lamps, heights, or positions and see real differences.
Key capabilities
Illuminance (LUX / Foot-candle)
Quick readings for practical evaluation in real environments.
Color Temperature (CCT)
Verify whether lighting matches your intended mood and use case.
Lux Distribution Mapping
Reveal patterns your eyes miss—uniformity is the real upgrade.
Blue-Light Metrics
Useful for screen, desk, and office lighting analysis.
CSV Export
For reports, comparisons, and proof of improvement.
Phone App Workflow
Connect → measure → export.
Is AH-300 for you?
AH-300 is for you if…
- You care about desk/office lighting comfort
- You adjust lighting and want to know what changed
- You shoot photos/videos and need even light
- You prefer proof over guessing
AH-300 is not for you if…
- You only want decorative lighting
- You never compare or adjust setups
- You don’t care about measurement or consistency
(And that’s okay.)
Light source compatibility
- Common white LEDs (home / office)
- Illuminance, CCT, and uniformity comparison
If lighting affects how you work, feel, or create — you deserve to see what’s actually happening.