If you measure sunlight at noon on a bright day, it is easy to assume that your plants are receiving plenty of light.
But a single PAR reading cannot tell you how much photosynthetic light a plant receives over the entire day.
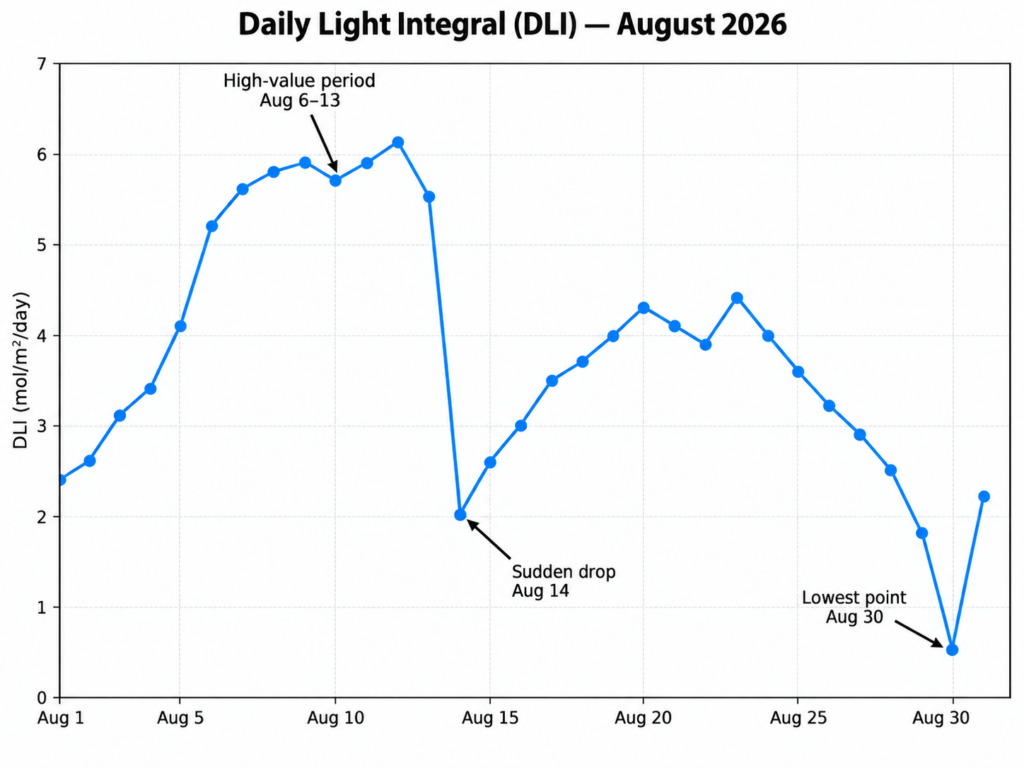
Our August 2026 dataset shows why.
Using an AH-PARDLI PAR/DLI logger, we recorded a DLI value for every day of August. The results ranged from just 5.219 mol/m²/day to 46.686 mol/m²/day.
That is almost a ninefold difference in daily photosynthetic light within the same month.
What Is DLI?
Daily Light Integral (DLI) is the total quantity of photosynthetically active photons received by one square meter during one day.
It is expressed as:
mol/m²/day
PAR or PPFD tells us the light intensity at a particular moment, while DLI tells us the total daily light dose.
Michigan State University describes DLI as the cumulative amount of photosynthetic light received each day and notes that outdoor DLI can range roughly from 5 to 60 mol/m²/day, depending on location and time of year.
August 2026: Key Results
Our 31-day dataset produced the following results:
| Metric | August 2026 Result |
|---|---|
| Average DLI | 29.361 mol/m²/day |
| Median DLI | 26.556 mol/m²/day |
| Highest DLI | 46.686 mol/m²/day |
| Highest Day | August 10 |
| Lowest DLI | 5.219 mol/m²/day |
| Lowest Day | August 30 |
| Highest-to-Lowest Difference | 8.95× |
| Days ≥40 mol/m²/day | 7 days |
| Days <20 mol/m²/day | 7 days |
The important result is not simply that some days were bright and others were dark.
It is how large the difference was.
The Daily Data
| Date | DLI (mol/m²/day) |
|---|---|
| Aug 1 | 21.326 |
| Aug 2 | 15.414 |
| Aug 3 | 24.664 |
| Aug 4 | 27.745 |
| Aug 5 | 32.681 |
| Aug 6 | 44.741 |
| Aug 7 | 41.629 |
| Aug 8 | 44.426 |
| Aug 9 | 45.994 |
| Aug 10 | 46.686 |
| Aug 11 | 40.638 |
| Aug 12 | 43.301 |
| Aug 13 | 39.409 |
| Aug 14 | 16.321 |
| Aug 15 | 37.471 |
| Aug 16 | 37.165 |
| Aug 17 | 26.556 |
| Aug 18 | 23.307 |
| Aug 19 | 39.657 |
| Aug 20 | 19.072 |
| Aug 21 | 24.444 |
| Aug 22 | 21.884 |
| Aug 23 | 34.756 |
| Aug 24 | 24.804 |
| Aug 25 | 36.143 |
| Aug 26 | 14.186 |
| Aug 27 | 17.057 |
| Aug 28 | 19.588 |
| Aug 29 | 22.169 |
| Aug 30 | 5.219 |
| Aug 31 | 21.733 |
Download the August 2026 DLI Dataset (CSV)
A Single PAR Reading Can Miss the Story
Consider August 13 and August 14.
DLI dropped from:
39.409 → 16.321 mol/m²/day
in just one day.
Then on August 15 it returned to:
37.471 mol/m²/day
A PAR meter used for only a few minutes might completely miss this difference.
You could measure the same location at a bright moment on both days and conclude that its light environment was similar.
The integrated daily light exposure tells a very different story.
This is one of the main reasons DLI must be measured over time rather than estimated from one instantaneous measurement.
August Was Not Consistent From Beginning to End
There was also a noticeable difference between the two halves of the month.
August 1–15 average:
34.830 mol/m²/day
August 16–31 average:
24.234 mol/m²/day
The second half of August therefore averaged approximately 30% less DLI than the first half.
That does not by itself prove a seasonal trend. Cloud cover, temporary shading, weather and other environmental conditions can strongly influence daily measurements.
But it demonstrates why growers should not assume that last week’s light conditions still apply today.
Purdue Extension similarly notes that solar DLI varies with season and that understanding this variation is useful for greenhouse and high-tunnel crop management.
Why Can DLI Change So Much?
Several factors can change the amount of photosynthetic light reaching the same location:
- Cloud cover
- Changing solar angle
- Day length
- Trees, buildings or temporary shadows
- Greenhouse glazing or shade cloth
- Seasonal changes
- Weather conditions
This is why regional DLI maps are useful for planning, but cannot replace measurement at the actual plant location.
Inside a greenhouse, the difference can be even greater. Michigan State University reports that greenhouse structures and glazing commonly reduce incoming light by roughly 35–50% compared with outdoors.
Why Growers Should Track DLI Every Day
Suppose a crop performs best around 20–25 mol/m²/day.
Looking only at the August average of 29.361 mol/m²/day might suggest that light was more than adequate.
But the daily data shows something the monthly average hides.
There were seven days below 20 mol/m²/day, including one day at only 5.219 mol/m²/day.
For greenhouse growers, this distinction can affect decisions about:
- Supplemental lighting
- Shade cloth
- Plant positioning
- Greenhouse transmission
- Crop scheduling
- Seasonal light management
The correct question therefore isn’t simply:
“What is my average DLI?”
A better question is:
“How often is my crop actually receiving its target DLI?”
Why Continuous Logging Matters
DLI cannot be determined from a single instantaneous reading.
It requires repeated PPFD measurements throughout the day and integration of those measurements into a daily total. Michigan State University specifically notes that DLI requires measurements over time rather than an instantaneous reading.
This is where a logger becomes different from a conventional handheld PAR meter.
AH-PARDLI records the changing PAR pattern and calculates daily DLI automatically. Historical data can then be viewed on a smartphone and exported for further analysis.
Instead of asking:
“How bright is it right now?”
you can ask:
“How much photosynthetic light did my plants actually receive today—and how does today compare with yesterday?”
That is a much more useful question for long-term plant management.
What This 31-Day Dataset Tells Us
The most important finding from August is simple:
Daily light is far less stable than it looks.
During one month:
- Maximum DLI was 46.686 mol/m²/day
- Minimum DLI was 5.219 mol/m²/day
- The difference was nearly 9×
- Seven days exceeded 40 mol/m²/day
- Seven days fell below 20 mol/m²/day
A monthly average cannot show these fluctuations.
A single midday PAR measurement certainly cannot.
For growers who depend on sunlight, the daily curve and accumulated DLI together provide a much clearer picture of the real light environment.
FAQ
Can I estimate DLI from one PAR measurement?
Not reliably under natural sunlight. PAR changes continuously with solar angle, clouds and shading. DLI is the integrated light received over the entire day.
Is a high monthly average DLI enough?
Not necessarily. A high average can hide individual low-light days. Crop performance may depend on how frequently the plant falls below its useful DLI range.
Why measure both PAR and DLI?
PAR/PPFD shows instantaneous light intensity. DLI shows total daily photon exposure. Looking at both reveals not only how much light a plant receives, but also how that light changes throughout the day.