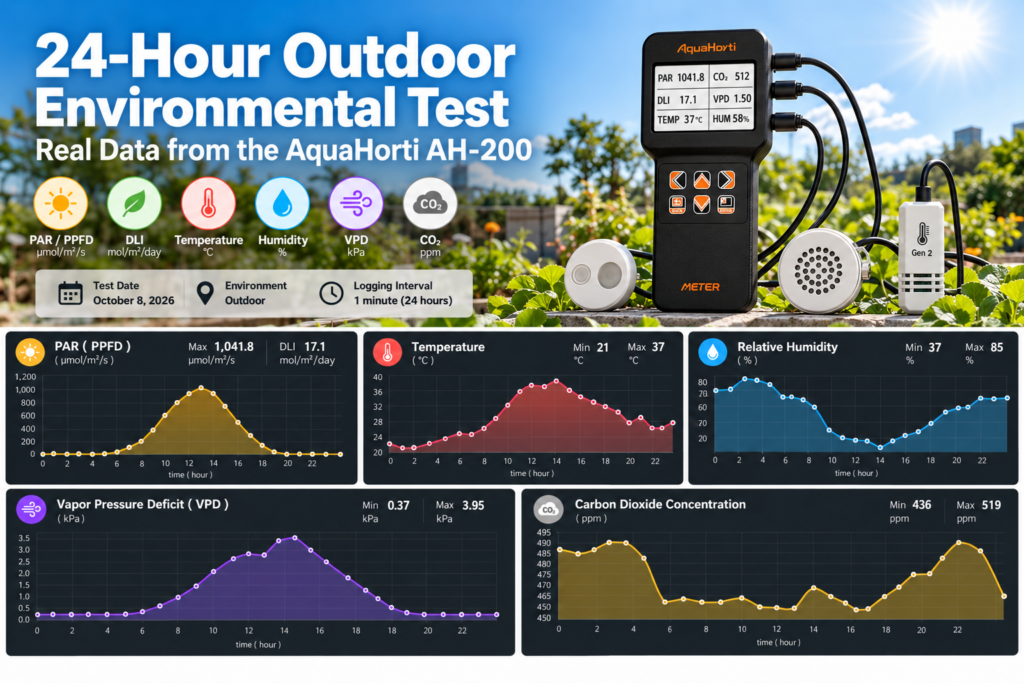
What actually happens to light, temperature, humidity, VPD and CO₂ over an entire day outdoors?
On October 8, 2026, we placed an AquaHorti AH-200 Plant Environment Monitor outdoors and recorded environmental data continuously from 00:00 to 23:59.
Rather than taking a few spot measurements, the AH-200 logged the environment throughout the full 24-hour period.
The test recorded:
- PPFD / PAR
- Temperature
- Relative humidity
- VPD
- CO₂ concentration
- Time-series data for CSV analysis
The result shows clearly why a single measurement cannot describe an entire growing day.
Quick Answer
During this 24-hour outdoor test, the AH-200 recorded a peak PPFD of 1,041.8 µmol/m²/s, temperatures from 21°C to 37°C, relative humidity from 37% to 85%, VPD from 0.37 to 3.95 kPa, and CO₂ from approximately 436 to 519 ppm.
Based on the minute-by-minute PPFD data, the calculated daily light integral was approximately:
17.1 mol/m²/day DLI
The strongest light occurred around midday, while the highest temperature and VPD occurred slightly later.
Test Setup
Test date: October 8, 2026
Environment: Outdoor
Logging period: 24 hours
Data interval: 1 minute
Total timestamps: 1,440
The AH-200 monitored several environmental variables simultaneously, allowing us to compare how sunlight, temperature, humidity, atmospheric dryness and CO₂ changed over the same day.
The exported CSV contains one-minute data instead of only the hourly points shown in the PC software charts.
Download the Raw 24-Hour CSV Data
Important: This is one outdoor measurement day at one measurement position. The results describe this specific test environment and should not be interpreted as universal outdoor targets for plants.
What Did the AH-200 Record During the 24-Hour Test?
| Measurement | Minimum | Maximum | 24-Hour Average |
|---|---|---|---|
| Temperature | 21°C | 37°C | 27.1°C |
| Relative Humidity | 37% | 85% | 60.7% |
| VPD | 0.37 kPa | 3.95 kPa | 1.55 kPa |
| CO₂ | 436 ppm | 519 ppm | 468.9 ppm |
| PPFD | 0 | 1,041.8 µmol/m²/s | 197.6 µmol/m²/s* |
*The 24-hour PPFD average includes nighttime hours when PPFD was zero.
The most useful part of the test is not any single maximum or minimum. It is seeing when the variables changed and how those changes occurred together.
1. Outdoor PPFD Changed Continuously Through the Day
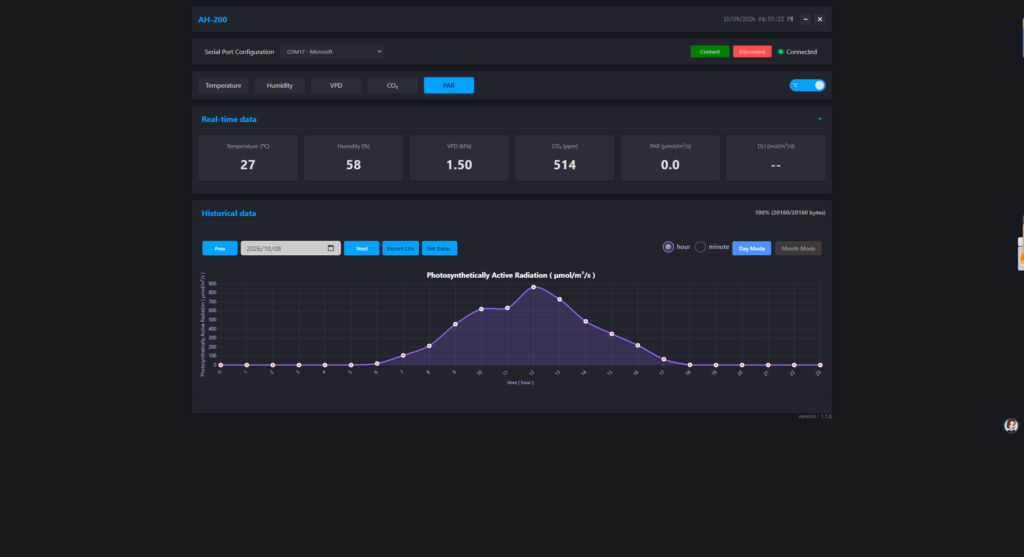
Hourly outdoor PAR trend recorded by the AH-200 during the October 8 test.At night, the PAR sensor recorded essentially zero photosynthetic light.
Light began increasing after approximately 06:00 and climbed rapidly through the morning.
The highest individual PPFD reading recorded during the test was:
1,041.8 µmol/m²/s at approximately 12:14 PM
The hourly-average PPFD reached its highest level during the 12:00–12:59 PM period:
approximately 866 µmol/m²/s
After midday, PPFD gradually declined until returning close to zero during the evening.
This produces the familiar outdoor light curve:
darkness → morning increase → midday peak → afternoon decline → darkness
But the actual curve was not perfectly smooth.
Outdoor light is affected by changing solar angle, clouds, shadows and surrounding objects. That means two measurements taken only minutes apart can sometimes be different.
This is one reason continuous logging can reveal information that a single handheld reading cannot.
2. The Calculated DLI Was About 17.1 mol/m²/day
PPFD tells us how much photosynthetically useful light is present at a particular moment.
DLI answers a different question:
How much photosynthetically useful light accumulated over the entire day?
Using the one-minute PPFD records from this test, the accumulated light was approximately:
DLI ≈ 17.1 mol/m²/day
DLI was calculated by integrating the recorded PPFD values over the 24-hour period.
This illustrates an important difference between PPFD and DLI.
A midday reading above 1,000 µmol/m²/s may appear very high, but that number alone does not tell us how much light accumulated throughout the complete day.
The duration and shape of the light period matter.
For more background on this distinction, see the AquaHorti Horticulture Measurement Guide:
3. Temperature Rose After Sunrise and Peaked During the Day
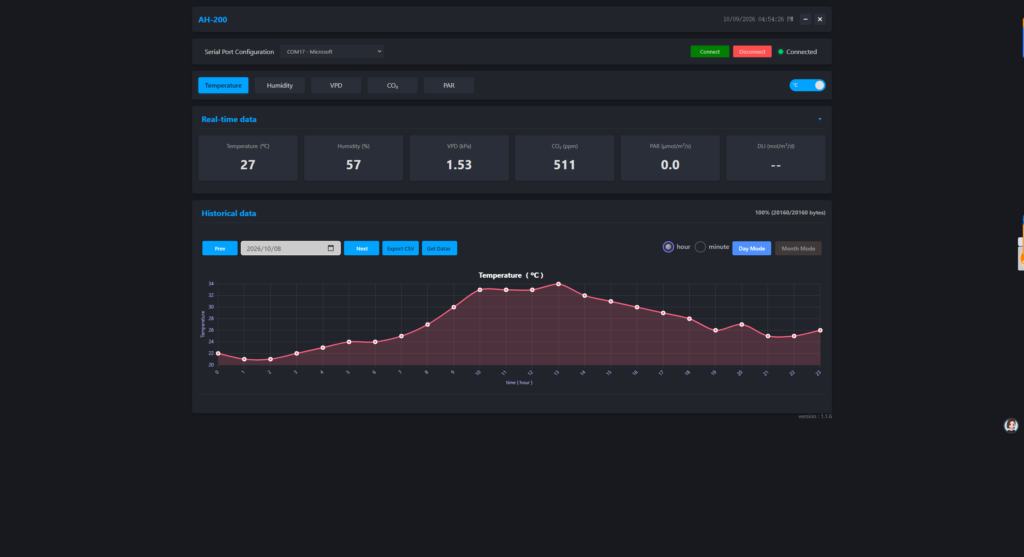
Temperature remained relatively low overnight.
The lowest recorded temperature was:
21°C
As sunlight increased during the morning, temperature also climbed rapidly.
The highest individual temperature recorded was:
37°C
Looking at hourly averages, temperature reached approximately:
33.9°C between 13:00 and 13:59
This is an interesting comparison with the light data.
The highest hourly PPFD occurred around noon, while the highest hourly temperature occurred approximately one hour later.
In other words:
maximum sunlight and maximum air temperature did not occur at exactly the same time.
This kind of timing difference is easy to miss with occasional spot measurements.
4. Relative Humidity Fell as the Air Became Warmer
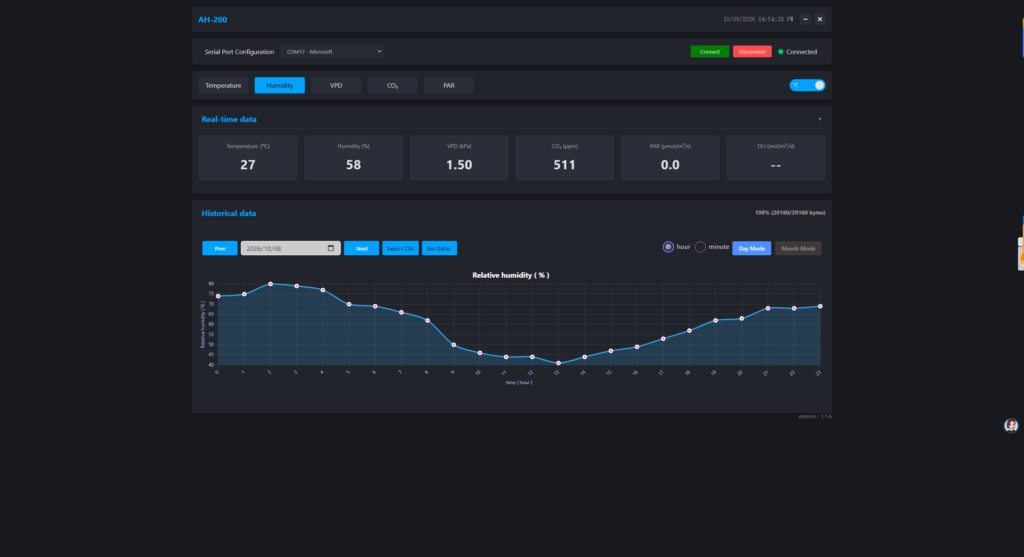
Humidity showed almost the opposite daily pattern.
During the night and early morning, relative humidity was high.
The maximum recorded RH was:
85%
As temperature rose during the day, relative humidity declined.
The lowest recorded RH was:
37%
During the 13:00 hour, when temperature averaged approximately 33.9°C, relative humidity averaged only about:
40.8% RH
Later in the afternoon and evening, temperature fell and relative humidity began increasing again.
This demonstrates why relative humidity should not always be interpreted by itself.
Temperature and humidity together determine the atmospheric moisture conditions represented by VPD.
5. VPD Increased Strongly During the Warm, Dry Part of the Day
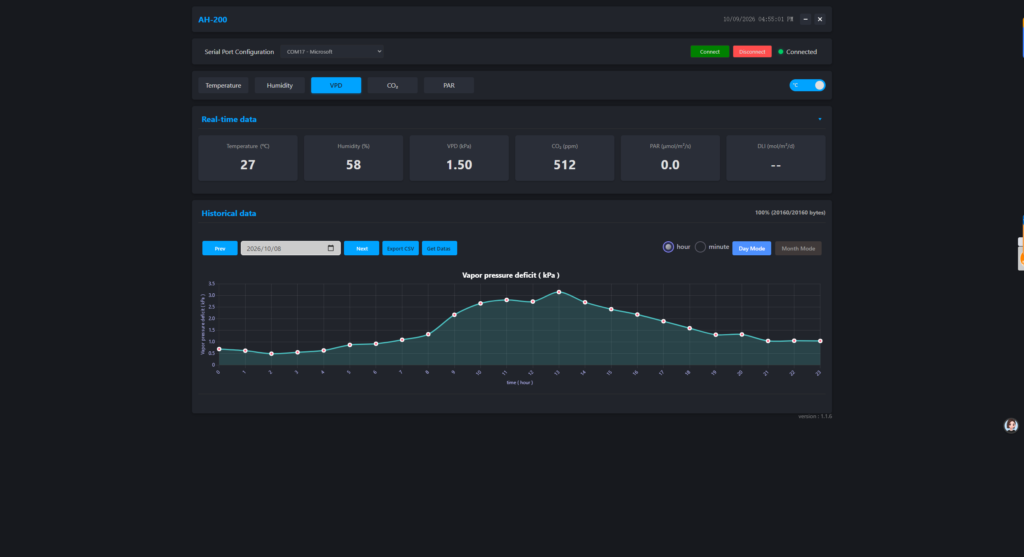
VPD increased as daytime temperature rose and relative humidity decreased.The AH-200 calculates Vapor Pressure Deficit (VPD) from the measured air temperature and relative humidity.
During the cooler, more humid nighttime period, VPD remained relatively low.
The lowest recorded value was:
0.37 kPa
As temperature increased and humidity decreased, VPD rose sharply.
The highest recorded VPD was:
3.95 kPa
The hourly average peaked at approximately:
3.15 kPa between 13:00 and 13:59
This corresponds closely with the period of:
- high temperature
- low relative humidity
- strong daylight
The relationship is clear in the recorded curves:
higher temperature + lower relative humidity → higher VPD
VPD therefore adds context that cannot be obtained from relative humidity alone.
6. Outdoor CO₂ Was Much More Stable Than Light or VPD
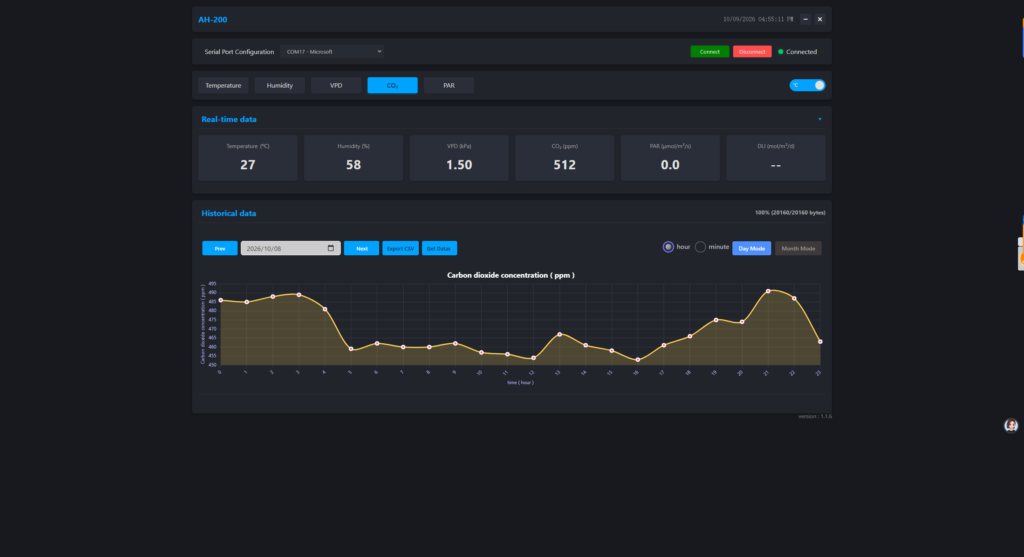
Outdoor CO2 remained relatively stable compared with the larger changes in PAR and VPD.CO₂ behaved very differently from PPFD, temperature and VPD.
During the 24-hour measurement period, recorded CO₂ ranged approximately from:
436 to 519 ppm
The 24-hour average was approximately:
469 ppm
Compared with the very large changes in sunlight and VPD, outdoor CO₂ remained within a relatively narrow range during this particular test.
For example, while PPFD changed from essentially:
0 to more than 1,000 µmol/m²/s
CO₂ stayed within roughly an 80 ppm range.
This does not mean outdoor CO₂ is always constant.
Local airflow, nearby vegetation, people, vehicles, buildings and weather conditions can all influence measured CO₂. The important observation here is simply what occurred at this specific measurement position on October 8.
7. Looking at the Measurements Together Reveals More Than Looking at Them Separately
The strongest result from this test is not the peak PPFD or maximum temperature.
It is the relationship between the measurements.
During the morning:
PPFD ↑ → Temperature ↑ → Humidity ↓ → VPD ↑
Around midday:
- PPFD reached its highest levels
- temperature was high
- relative humidity was low
- VPD was high
- CO₂ remained comparatively stable
During the afternoon:
PPFD ↓ → Temperature ↓ → Humidity ↑ → VPD ↓
This is exactly why environmental measurements become more useful when they share the same timeline.
Instead of asking only:
“What is the PAR right now?”
we can ask:
“What was happening to light, temperature, humidity, VPD and CO₂ at the same time?”
That provides much more context for understanding a plant’s actual environment.
Selected Hourly Data from the Test
Here are several representative hourly averages from the October 8 dataset:
| Time | Temp. | RH | VPD | CO₂ | PPFD |
|---|---|---|---|---|---|
| 00:00–00:59 | 22.2°C | 74.3% | 0.69 kPa | 486 ppm | 0 |
| 06:00–06:59 | 24.0°C | 68.9% | 0.92 kPa | 462 ppm | 17 |
| 09:00–09:59 | 30.5°C | 50.4% | 2.17 kPa | 462 ppm | 454 |
| 12:00–12:59 | 32.6°C | 44.2% | 2.74 kPa | 454 ppm | 866 |
| 13:00–13:59 | 33.9°C | 40.8% | 3.15 kPa | 467 ppm | 730 |
| 18:00–18:59 | 27.6°C | 56.8% | 1.59 kPa | 466 ppm | 2 |
| 23:00–23:59 | 26.0°C | 69.0% | 1.04 kPa | 463 ppm | 0 |
PPFD values are in µmol/m²/s.
These hourly averages are useful for visualizing the overall daily trend, while the exported CSV preserves the much finer one-minute measurements.
Why One PAR Reading Is Not Enough Outdoors
Suppose we measured PPFD only once at noon.
We might have recorded approximately:
800–1,000 µmol/m²/s
From that number alone, it would be easy to assume the plants were receiving extremely strong light throughout the day.
But the complete dataset tells a different story.
Light was:
- zero overnight
- low around sunrise
- rapidly increasing during the morning
- strongest near midday
- decreasing during the afternoon
- zero again at night
The full-day accumulated DLI was therefore approximately:
17.1 mol/m²/day
This is why PPFD and DLI answer different questions.
PPFD describes a moment.
DLI describes the accumulated light over time.
What Does This Outdoor Test Demonstrate?
This experiment was not designed to establish an “ideal” temperature, VPD, PPFD or CO₂ value for a particular crop.
Instead, it demonstrates a measurement principle:
A growing environment is a time series, not a single number.
For outdoor growing, greenhouses and other environments where conditions change throughout the day, logging can help identify:
- when light begins increasing
- peak PPFD
- accumulated DLI
- periods of high temperature
- periods of low humidity
- high-VPD periods
- CO₂ changes
- relationships between different environmental variables
Those patterns can be difficult to see from occasional measurements alone.
About the AH-200
The AquaHorti AH-200 combines:
PAR / PPFD + DLI + CO₂ + Temperature + Humidity + VPD
with historical data recording and CSV export.
The system uses external sensors so measurements can be positioned where the growing environment is actually being evaluated.
Recorded data can then be reviewed as trends rather than only as instantaneous readings.
Learn more about the AH-200:
For a broader explanation of PAR, DLI, CO₂ and VPD measurement:
Read our Horticulture Measurement Guide
Frequently Asked Questions
What was the peak PPFD in the outdoor AH-200 test?
The highest one-minute PPFD reading recorded on October 8, 2026 was approximately 1,041.8 µmol/m²/s, occurring around 12:14 PM.
What was the DLI for the full day?
Integration of the one-minute PPFD data gives a daily light integral of approximately 17.1 mol/m²/day.
What was the highest VPD recorded?
The highest recorded VPD was approximately 3.95 kPa. VPD increased as daytime temperature rose and relative humidity fell.
How much did outdoor CO₂ change?
CO₂ measurements ranged from approximately 436 to 519 ppm during this test, with a 24-hour average of approximately 469 ppm.
Why measure PAR, CO₂ and VPD together?
Because these variables change simultaneously. Measuring them on the same timeline makes it easier to see the environmental conditions surrounding a particular light level instead of interpreting PPFD, temperature, humidity or CO₂ in isolation.
Is this dataset a recommended growing target?
No. These are observed values from one outdoor test on October 8, 2026, not recommended crop setpoints. Appropriate environmental conditions depend on plant species, growth stage, location and growing system.
Final Takeaway
A single outdoor measurement tells you what was happening at one moment.
A full day of data tells you the story.
In this October 8 outdoor test, the AquaHorti AH-200 recorded the transition from humid nighttime conditions to strong midday sunlight, higher temperature and higher VPD, followed by the return to cooler and more humid evening conditions.
The dataset captured:
PPFD peak: 1,041.8 µmol/m²/s
Calculated DLI: ≈17.1 mol/m²/day
Temperature: 21–37°C
Relative humidity: 37–85%
VPD: 0.37–3.95 kPa
CO₂: 436–519 ppm
For growers, researchers and controlled-environment users, the practical lesson is simple:
Measure the trend, not just the moment.