September 2026 PAR and DLI Data: What 30 Days of AH-PARDLI Logging Show
How much can outdoor plant light change over an entire month?
To find out, we analyzed 30 consecutive days of PAR and Daily Light Integral (DLI) data recorded during September 2026 with an AquaHorti AH-PARDLI.
The results show substantial day-to-day variation.
Across September 1–30, 2026:
- Average DLI: 37.028 mol/m²/day
- Median DLI: 39.154 mol/m²/day
- Highest DLI: 49.221 mol/m²/day on September 11
- Lowest DLI: 15.070 mol/m²/day on September 1
- Highest-to-lowest DLI ratio: approximately 3.27×
- Days with DLI ≥ 40 mol/m²/day: 14
- Days with DLI below 30 mol/m²/day: 5
- Highest recorded instantaneous PPFD: 2,906.05 µmol/m²/s on September 13
One of the clearest lessons from the dataset is that the highest instantaneous PPFD did not occur on the day with the highest DLI.
That distinction is important when evaluating the light plants actually receive over time.
Quick Answer: What Did the September 2026 Data Show?
During the 30-day test, daily DLI ranged from 15.070 to 49.221 mol/m²/day.
The highest-DLI day therefore delivered about:
49.221 ÷ 15.070 = 3.27 times
as much accumulated photosynthetically active light as the lowest-DLI day.
The September average was:
37.028 mol/m²/day
However, that monthly average hides substantial day-to-day variation.
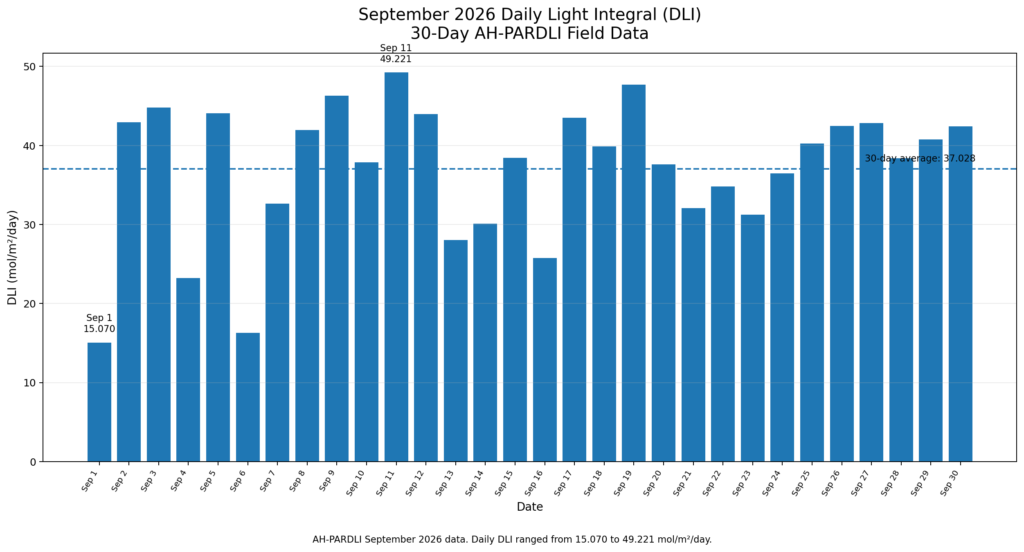
Some days exceeded 40 mol/m²/day, while others fell below 20 mol/m²/day.
For growers, this illustrates why a single PAR measurement cannot describe the complete light environment experienced by a plant.
September 2026 Daily DLI Results
| Date | DLI (mol/m²/day) |
|---|---|
| Sep. 1 | 15.070 |
| Sep. 2 | 42.953 |
| Sep. 3 | 44.793 |
| Sep. 4 | 23.220 |
| Sep. 5 | 44.043 |
| Sep. 6 | 16.285 |
| Sep. 7 | 32.642 |
| Sep. 8 | 38.047 |
| Sep. 9 | 46.272 |
| Sep. 10 | 41.807 |
| Sep. 11 | 49.221 |
| Sep. 12 | 43.974 |
| Sep. 13 | 28.016 |
| Sep. 14 | 30.086 |
| Sep. 15 | 40.147 |
| Sep. 16 | 25.774 |
| Sep. 17 | 43.485 |
| Sep. 18 | 39.892 |
| Sep. 19 | 47.679 |
| Sep. 20 | 37.789 |
| Sep. 21 | 32.055 |
| Sep. 22 | 34.794 |
| Sep. 23 | 31.241 |
| Sep. 24 | 36.448 |
| Sep. 25 | 40.230 |
| Sep. 26 | 42.451 |
| Sep. 27 | 42.850 |
| Sep. 28 | 38.362 |
| Sep. 29 | 40.753 |
| Sep. 30 | 42.395 |
The Highest-DLI Day: September 11
September 11 recorded the highest DLI of the month:
49.221 mol/m²/day
The maximum recorded PPFD that day was:
2,172.35 µmol/m²/s
at approximately 13:40 in the exported data.
This was not the highest instantaneous PPFD recorded during September.
Instead, the high DLI reflects the amount of photosynthetically active light accumulated throughout the full daily measurement period.
This distinction is important:
DLI is determined by both light intensity and the amount of time that light is available.
The Lowest-DLI Day: September 1
September 1 recorded the lowest DLI:
15.070 mol/m²/day
The maximum measured PPFD that day was:
979.80 µmol/m²/s
The difference between September 1 and September 11 was substantial:
- September 1: 15.070 mol/m²/day
- September 11: 49.221 mol/m²/day
The highest-DLI day therefore accumulated approximately 227% more photosynthetically active light than the lowest-DLI day.
For a plant remaining in the same measurement position, this represents a major difference in daily photon exposure.
The Most Interesting Result: Highest PPFD Did Not Mean Highest DLI
September 13 provides one of the most useful examples in the entire dataset.
On September 13, the AH-PARDLI recorded an instantaneous PPFD peak of:
2,906.05 µmol/m²/s
at approximately 12:40.
That was the highest recorded PPFD value in the September dataset.
However, the day’s DLI was only:
28.016 mol/m²/day
Compare that with September 11:
| Date | Peak PPFD | DLI |
|---|---|---|
| Sep. 11 | 2,172.35 µmol/m²/s | 49.221 mol/m²/day |
| Sep. 13 | 2,906.05 µmol/m²/s | 28.016 mol/m²/day |
September 13 produced a much higher instantaneous peak, yet September 11 accumulated approximately 75.7% more daily light.
This is a real-data example of why one midday PAR measurement can be misleading.
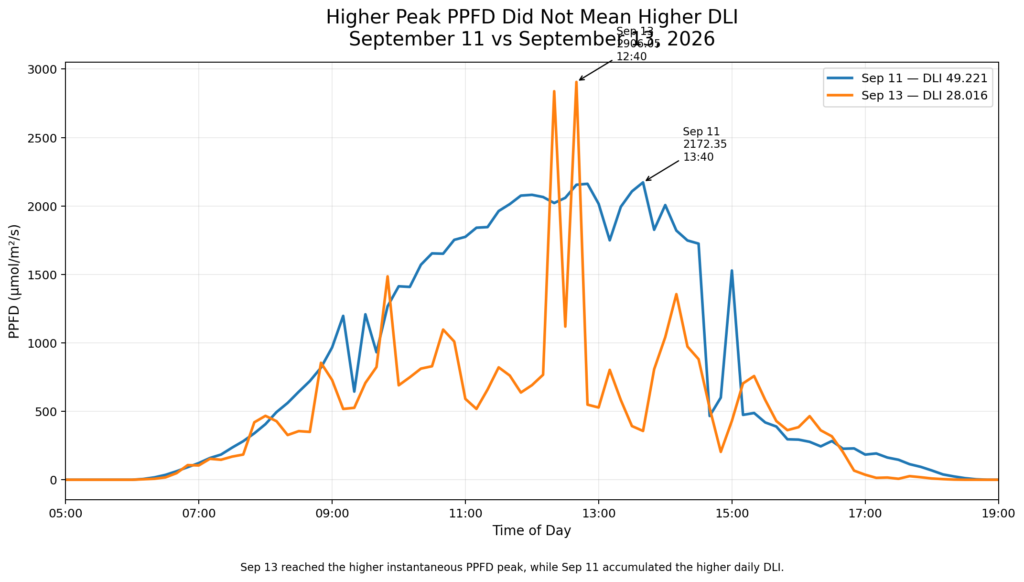
PAR/PPFD comparison for September 11 and September 13, 2026. September 13 reached the higher instantaneous PPFD peak, while September 11 accumulated the higher daily DLI.A very high PPFD reading may last for only a short period.
DLI accounts for the light accumulated across the day.
PPFD and DLI Measure Different Things
What is PPFD?
Photosynthetic Photon Flux Density, or PPFD, measures the instantaneous amount of photosynthetically active photons reaching a surface.
It is normally expressed as:
µmol/m²/s
PPFD answers the question:
How much photosynthetically active light is reaching this location right now?
What is DLI?
Daily Light Integral measures the accumulated quantity of photosynthetically active photons received over a daily period.
It is expressed as:
mol/m²/day
DLI answers a different question:
How much photosynthetically active light accumulated here during the day?
The September data show why both measurements are useful.
PPFD describes intensity at a particular moment.
DLI describes accumulated exposure over time.
14 of 30 Days Exceeded 40 mol/m²/day
Another useful way to look at the September dataset is by grouping the days according to their DLI.
During the 30-day period:
14 days reached at least 40 mol/m²/day.
At the other end of the range:
5 days remained below 30 mol/m²/day.
So even within a single month, the measured location moved between substantially different daily light conditions.
This makes repeated measurements particularly useful in environments influenced by natural sunlight.
Daily Light Was More Stable Toward the End of September
The data also show differences across different parts of the month.
Average DLI for September 1–10 was approximately:
34.51 mol/m²/day
For September 11–20:
38.41 mol/m²/day
For September 21–30:
38.16 mol/m²/day
The first third of September contained some of the largest low-light events, including:
- Sep. 1 — 15.070
- Sep. 4 — 23.220
- Sep. 6 — 16.285 mol/m²/day
By comparison, all ten days from September 21 through September 30 remained above 31 mol/m²/day.
This does not establish a seasonal trend from one month of data, but it does show that the final part of the measured month was more consistent at this particular measurement location.
Why One Midday Reading Is Not Enough
Suppose a grower checks PAR around noon and sees a very high number.
That measurement is useful.
But it cannot tell us what happened earlier in the morning or later in the afternoon.
It also cannot tell us whether the high value lasted for several hours or only a short period.
September 13 illustrates this clearly.
Its PPFD briefly reached 2,906.05 µmol/m²/s, the highest instantaneous value in the dataset.
Yet its DLI was just 28.016 mol/m²/day.
By contrast, September 11 had a lower peak but produced 49.221 mol/m²/day.
For evaluating total plant-light exposure, the duration and shape of the light curve matter.
What Can Cause PAR to Change During the Day?
The AH-PARDLI records the light reaching the sensor.
The dataset itself does not identify the physical cause of each increase or decrease.
Possible influences can include:
- changing cloud cover
- shadows from nearby objects
- vegetation moving in the wind
- changing solar angle
- temporary sensor obstruction
- surrounding buildings or structures
Without synchronized weather observations or site records, it would be incorrect to automatically assign a specific cause to an individual PPFD drop or peak.
The logger tells us how the measured light changed.
Additional information is required to establish why it changed.
About the September 12 and September 26 PAR Records
During data review, we identified unusual time placement in the exported PAR records for September 12 and September 26.
On these two dates, strong light values appear around midnight in the PAR time series, which is inconsistent with the surrounding daily records.
For data-quality reasons, we therefore did not use these two dates to draw conclusions about the time of day when peak PPFD occurred.
Their daily DLI values remain included in the monthly DLI dataset:
- September 12: 43.974 mol/m²/day
- September 26: 42.451 mol/m²/day
Clearly documenting unusual records is important when analyzing long-term logger data.
How the September Data Were Analyzed
This analysis used two AH-PARDLI exported datasets:
- A PAR/PPFD dataset containing readings at 10-minute intervals.
- A DLI dataset containing the accumulated daily DLI values.
For September 1 through September 30, we reviewed:
- daily DLI
- maximum recorded PPFD
- timing of daily PPFD peaks where the time series was valid
- day-to-day DLI variation
- monthly average and median
- representative high-light and low-light days
The purpose of the analysis is to describe the measured light environment.
Download the September 2026 Raw PAR and DLI Data
PAR / PPFD Data — 10-Minute Measurements (XLSX)
Daily Light Integral (DLI) Data (XLSX)
It is not intended to infer weather conditions or predict a specific plant response without additional data.
What Can Growers Learn From 30-Day PAR and DLI Logging?
Longer-term light monitoring can help answer practical questions that a single handheld measurement cannot.
For example:
How much does DLI change from one day to another?
Is a location consistently bright, or does its daily light vary significantly?
Does a high midday PPFD actually translate into a high daily light total?
Are two growing positions that appear similar receiving the same accumulated light?
Is light exposure becoming more or less consistent over time?
These are particularly relevant questions for:
- outdoor growing areas
- greenhouses
- balconies
- windowsills
- supplemental-light installations
- grow-light testing
- plant-location comparisons
What This Dataset Does Not Prove
PAR and DLI data quantify the photosynthetically active light reaching the sensor.
They do not independently determine whether that light level is ideal for a particular plant.
Plant responses can also depend on factors such as:
- species
- growth stage
- temperature
- water availability
- humidity
- nutrition
- CO₂ concentration
This September dataset should therefore be interpreted as a measurement of the light environment, rather than as a recommendation for any individual crop or plant species.
Frequently Asked Questions
What was the average DLI during September 2026?
The average of all 30 daily measurements was approximately 37.028 mol/m²/day.
What was the highest DLI?
The highest recorded daily DLI was 49.221 mol/m²/day on September 11, 2026.
What was the lowest DLI?
The lowest was 15.070 mol/m²/day on September 1, 2026.
How much did daily light vary during the month?
The highest DLI was approximately 3.27 times the lowest DLI.
What was the highest PPFD recorded?
The highest instantaneous PPFD in the September dataset was 2,906.05 µmol/m²/s on September 13.
Did the highest-PPFD day also have the highest DLI?
No.
September 13 had the highest instantaneous PPFD at 2,906.05 µmol/m²/s, but its DLI was only 28.016 mol/m²/day.
September 11 had a lower maximum PPFD of 2,172.35 µmol/m²/s, but accumulated the month’s highest DLI of 49.221 mol/m²/day.
Why can a lower peak PPFD produce a higher DLI?
Because DLI depends on both light intensity and duration.
Moderately high PPFD maintained over many hours can accumulate more total photons than a brief period of extremely high PPFD.
How often was PAR recorded?
The exported PAR dataset contains measurements at 10-minute intervals, allowing the changing daily light curve to be examined rather than relying on isolated spot readings.
Main Takeaway
The September 2026 AH-PARDLI dataset demonstrates why daily light should be evaluated over time rather than from a single reading.
Across 30 days:
DLI ranged from 15.070 to 49.221 mol/m²/day.
The monthly average was:
37.028 mol/m²/day.
And perhaps most importantly:
the day with the highest instantaneous PPFD was not the day with the highest DLI.
September 13 briefly reached 2,906.05 µmol/m²/s, yet accumulated only 28.016 mol/m²/day.
September 11 peaked at a lower 2,172.35 µmol/m²/s, but accumulated 49.221 mol/m²/day.
That is why PPFD and DLI should be considered together when evaluating changing plant-light conditions.
A spot PAR measurement tells you what is happening now.
A PAR and DLI logger shows what happened throughout the day — and across many days.
Learn more about AH-PARDLI PAR and DLI monitoring on AquaHorti.