Does a cooler white light contain a higher proportion of blue light than a warmer white light?
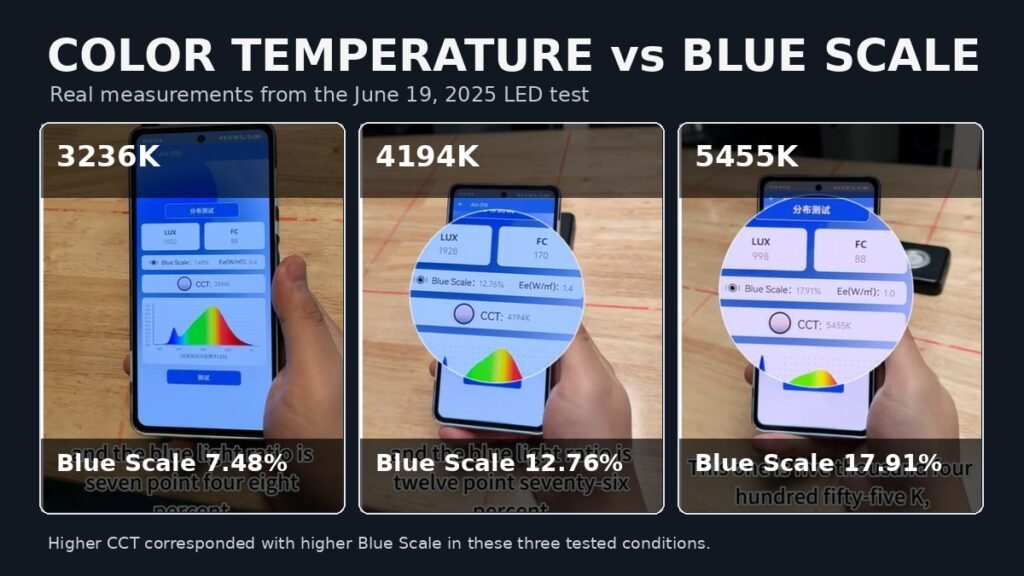
In this practical test, we measured three white-light conditions with different correlated color temperatures.
The measured results were:
3,236 K → 7.48% Blue Scale
4,194 K → 12.76% Blue Scale
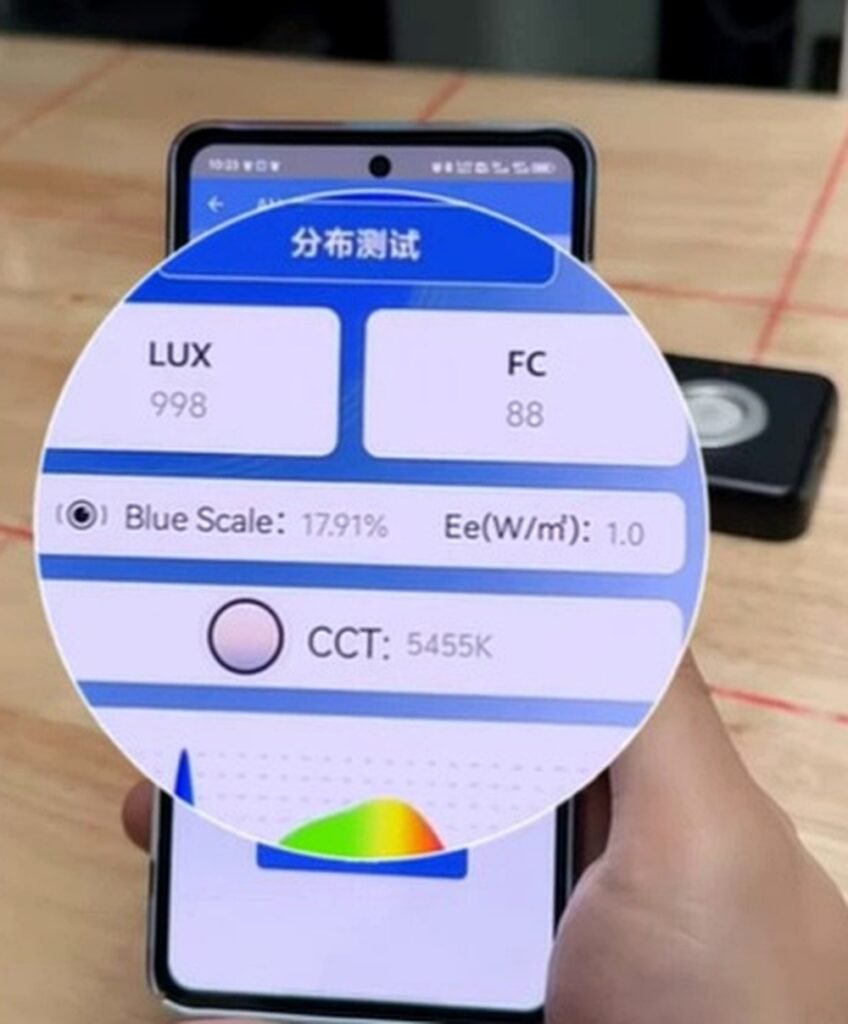
5,455 K → 17.91% Blue Scale
Within these three measurements, the displayed Blue Scale increased as the measured color temperature increased.
However, this result should not be interpreted as a universal conversion between CCT and blue-light content. Different LED designs can produce different spectral distributions even at similar color temperatures.
Video published: June 19, 2025
Direct Answer: Does Higher Color Temperature Mean More Blue Light?
In this test, yes.
The measured color temperature increased from 3,236 K to 4,194 K to 5,455 K, while the displayed Blue Scale increased from:
7.48% → 12.76% → 17.91%
So for the three white-light conditions tested here, higher CCT corresponded with a higher measured Blue Scale.
This agrees with the general behavior of many conventional white-light sources: increasing correlated color temperature usually requires a greater short-wavelength contribution. The U.S. Department of Energy has similarly noted that increasing CCT generally requires a higher proportion of blue light in the emitted spectrum.
But CCT alone does not fully describe a spectrum.
What Was Measured?
The video shows a light sensor connected to a smartphone measurement interface.
Three different white-light conditions were measured.
| Test | Measured CCT | Blue Scale | Illuminance |
|---|---|---|---|
| 1 | 3,236 K | 7.48% | 1,002 lux |
| 2 | 4,194 K | 12.76% | 1,928 lux |
| 3 | 5,455 K | 17.91% | 998 lux |
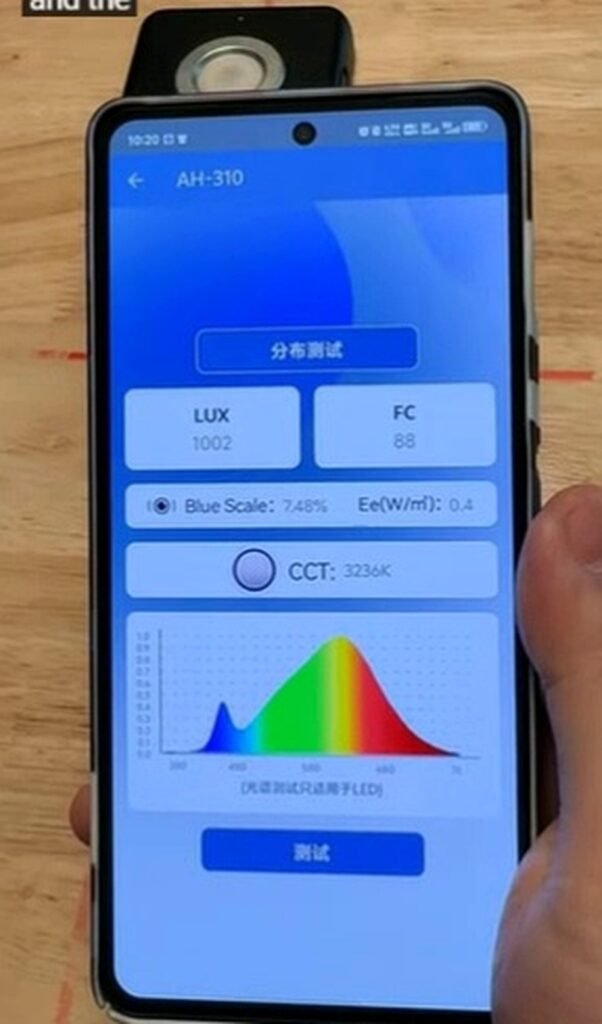
The trend in the displayed Blue Scale was monotonic:
7.48% → 12.76% → 17.91%
From the lowest-CCT condition to the highest-CCT condition, the Blue Scale increased by:
17.91 − 7.48 = 10.43 percentage points
That comparison applies only to the Blue Scale metric shown by this measurement system.
What Does CCT Mean?
CCT stands for correlated color temperature.
It describes the color appearance of a white light source in kelvin.
Lower CCT values generally appear warmer and more yellow or amber.
Higher CCT values generally appear cooler and more bluish.
NIST explains that CCT is commonly used to represent the chromaticity of white light sources, although CCT alone does not completely describe the chromaticity or spectral characteristics of a source. NIST
Typical examples include:
| Approximate CCT | General appearance |
|---|---|
| 2700 K | Warm white |
| 3000 K | Warm white |
| 4000 K | Neutral white |
| 5000 K | Cool white |
| 6500 K | Daylight-like white |
These names are approximate descriptions rather than strict spectral definitions.
Why Does Higher-CCT White Light Often Contain More Blue?
Many white LEDs use a short-wavelength LED emitter together with phosphor materials.
A common design uses a blue LED chip, often in the region around the blue portion of the visible spectrum, together with phosphor emission at longer wavelengths.
Changing the balance between the shorter-wavelength and longer-wavelength components changes the apparent color of the resulting white light.
When the relative contribution of shorter-wavelength light increases, the white light generally shifts toward a higher CCT.
That is why cooler white LEDs often show a more prominent blue component than warmer white LEDs.
The Department of Energy has reported that increasing CCT generally requires an increased proportion of blue light, while also emphasizing that spectral details depend on the particular source design.
What Does “Blue Scale” Mean in This Test?
The smartphone interface in the video reports a metric labeled:
Blue Scale
with values of:
7.48%
12.76%
and
17.91%
In this article, the phrase blue-light ratio refers specifically to this displayed Blue Scale measurement.
It should not be confused with a standardized blue-light hazard value.
The CIE defines a separate blue-light hazard spectral weighting function for photobiological safety evaluation. That is a different concept from simply reporting the proportion of short-wavelength content in a visible-light spectrum. CIE
Therefore:
Blue Scale percentage ≠ blue-light hazard percentage
This experiment is about spectral composition, not a health or safety assessment.
How Much Did Blue Scale Increase?
Between 3,236 K and 4,194 K:
12.76% − 7.48% = 5.28 percentage points
Between 4,194 K and 5,455 K:
17.91% − 12.76% = 5.15 percentage points
Across the full measured range:
17.91% − 7.48% = 10.43 percentage points
The progression is notably consistent in this particular test.
However, three measurements are not enough to establish a universal mathematical relationship between CCT and Blue Scale.
Does the Result Mean Blue Scale Is Determined by CCT?
No.
CCT and spectral composition are related, but they are not interchangeable.
Two LEDs can have the same or similar CCT while still having different spectral power distributions.
CIE research has analyzed spectral distributions from 1,516 LED products and grouped them by similar correlated color temperature. This reinforces why CCT should not be treated as a complete description of an LED spectrum.
So the correct conclusion is:
Higher CCT was associated with higher Blue Scale in these three tested conditions, but CCT alone cannot predict the exact spectrum of every LED.
Why Were the Lux Readings Different?
The three illuminance readings were not identical:
3,236 K → 1,002 lux
4,194 K → 1,928 lux
5,455 K → 998 lux
This means the experiment was not a matched-illuminance comparison.
The middle condition was measured at substantially higher illuminance than the other two.
That is important because this test should not be used to compare the absolute quantity of blue radiant power emitted by the three conditions.
Instead, the useful observation is the change in the displayed Blue Scale percentage.
For a more controlled experiment, the light output and measurement geometry should be kept as similar as possible while CCT is changed.
Is Blue Scale the Same as Lux?
No.
Lux measures illuminance — how much visible-light-weighted luminous flux reaches a surface.
Blue Scale is intended to describe a characteristic of the light’s spectral composition.
For example, two sources could both measure approximately 1,000 lux while still having different spectral distributions.
This is why measurements such as:
lux
CCT
spectral distribution
and
Blue Scale
describe different properties of a light source.
Can Two Lights With the Same CCT Have Different Blue Content?
Yes.
CCT compresses the perceived white color of a light source into a single number.
It does not uniquely identify the spectral power distribution.
Different combinations of wavelengths can produce similar chromaticity and similar CCT.
That means two 5000 K LEDs, for example, do not necessarily have identical blue spectral components.
This is one reason direct spectral or spectrum-based measurement can be useful when spectral composition matters.
Does This Test Show That 5455K Is “Worse” Than 3236K?
No.
This experiment does not evaluate health risk, eye damage, sleep effects or photobiological safety.
It only compares the light characteristics displayed by the measurement system.
The CIE specifically cautions against using the term “blue light hazard” loosely for general health or well-being claims. CIE
Whether a light exposure is relevant to any biological effect depends on factors beyond CCT, including spectral distribution, intensity, exposure duration and viewing conditions.
Those questions are outside the scope of this test.
What Is the Main Takeaway?
The clearest result from this experiment is:
3,236 K → 7.48%
4,194 K → 12.76%
5,455 K → 17.91%
Within the three tested conditions, increasing color temperature was accompanied by an increasing Blue Scale reading.
The result supports the general relationship between higher CCT and increased short-wavelength contribution in many white LEDs.
But the data should not be generalized into a fixed formula such as:
“Every increase of 1,000 K produces a specific percentage increase in blue light.”
Actual spectra depend on the LED package, phosphor formulation, optics, drive conditions and other design factors.
Test Limitations
This is a practical demonstration using three light conditions.
The test has several important limitations.
The illuminance was not held constant across all three measurements, and the experiment does not provide a calibrated wavelength-by-wavelength spectral power distribution.
The Blue Scale metric is also specific to the measurement system shown in the video and should not automatically be equated with standardized photobiological metrics.
The measurements therefore demonstrate a trend in these tested lights rather than a universal law for all white LEDs.
Related Lighting Measurement Tests
For a test comparing color temperature and point illuminance after luminous flux was brought close together, see our Does Color Temperature Affect Lux? 2700K vs 5700K LED Test.
For a visual explanation of wavelength separation, see our Prism Visible Light Spectrum Test.
For another real-world blue-light measurement example, see our Computer Monitor Blue Light Test.
About the Light Measurement System
The video shows an earlier light-measurement setup displaying illuminance, CCT, Blue Scale and a spectrum preview.
For our current LUX and CCT measurement solution:
Learn more: AH-300 Light Meter – LUX & CCT Measurement
Frequently Asked Questions
Does higher color temperature mean more blue light?
For many conventional white-light sources, higher CCT is generally associated with a greater proportion of short-wavelength light. In this test, Blue Scale increased from 7.48% at 3,236 K to 17.91% at 5,455 K.
What Blue Scale was measured at 3236K?
The measurement system displayed 7.48% Blue Scale at a measured CCT of 3,236 K.
What Blue Scale was measured at 4194K?
At 4,194 K, the displayed Blue Scale was 12.76%.
What Blue Scale was measured at 5455K?
At 5,455 K, the displayed Blue Scale was 17.91%.
Does CCT tell you the exact amount of blue light?
No. CCT describes the color appearance of white light but does not uniquely define its spectral power distribution. Different LED designs can have similar CCT values and different spectra.
Is Blue Scale the same as blue-light hazard?
No. The Blue Scale percentage shown in this experiment is a light-composition metric from the measurement system. Blue-light hazard assessment uses different standardized spectral weighting and exposure criteria.