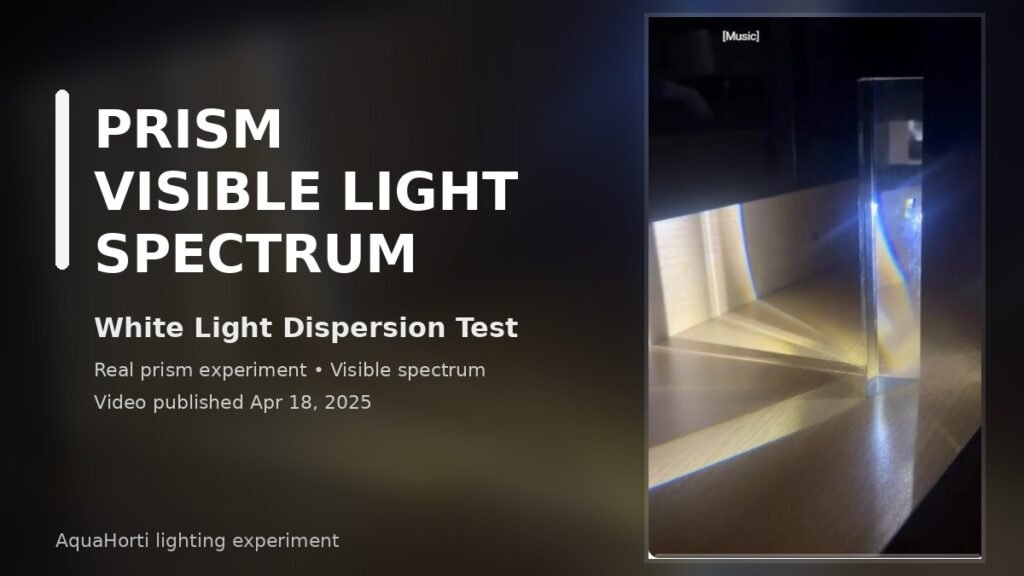
White light can look like a single color to our eyes, but it contains a range of visible wavelengths.
In this short experiment, we first passed light through a glass prism and projected the result onto a surface. A band of different colors became visible.
The video then shows another way to examine a light source: using a spectrum-capable light measurement system to display its spectral distribution.
Video published: April 18, 2025
Direct Answer: Why Does a Prism Split White Light?
A prism separates white light because different wavelengths of light are refracted by slightly different amounts when they pass through the glass.
Shorter and longer wavelengths therefore leave the prism at different angles, producing a visible band of colors.
NASA describes visible light as roughly 380 to 700 nanometers, with violet at the shorter-wavelength end and red at the longer-wavelength end. NASA Science
This wavelength-dependent bending is called dispersion.
What Can Be Seen in the Video?
The first part of the video shows a beam passing through a transparent prism.
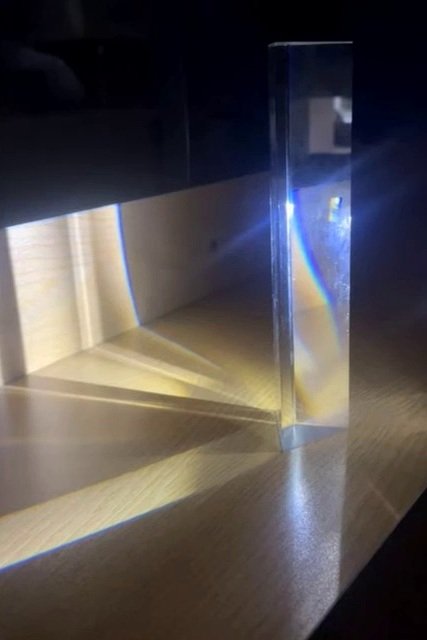
After leaving the prism, the light no longer appears as a single white band.
Instead, several colors can be seen along the edge of the projected light.
This is a simple visual demonstration that the incoming light contains multiple visible wavelengths.
What Is the Visible Spectrum?
The visible spectrum is the portion of electromagnetic radiation that can normally be detected by the human eye.
A commonly used approximate range is:
| Color region | Approximate wavelength |
|---|---|
| Violet | 380–450 nm |
| Blue | 450–495 nm |
| Green | 495–570 nm |
| Yellow | 570–590 nm |
| Orange | 590–620 nm |
| Red | 620–700 nm |
These boundaries are approximate rather than sharp divisions.
NASA notes that when visible light passes through a prism, the wavelengths separate because each wavelength is refracted by a different amount. NASA Science
Why Do the Colors Separate?
When light moves from air into glass and then back into air, its direction changes.
This is called refraction.
The amount of refraction depends partly on wavelength.
Because the refractive index of glass is not exactly the same for every wavelength, the different components of white light follow slightly different paths.
The result is dispersion:
white light → prism → separated visible colors
NASA describes the same principle: different wavelengths are slowed and bent by different amounts as they pass through a prism. NASA Science
Is the Rainbow From a Prism a Spectrum?
Yes.
The band of colors produced by a prism is a visible representation of the light’s spectrum.
However, a prism demonstration mainly provides a qualitative visual result.
You can see that different colors are present, but simply looking at the projected rainbow does not tell you precisely how much optical energy exists at each wavelength.
That requires a measurement instrument.
Prism vs Spectrum preview
The two methods shown in the video answer related but different questions.
| Method | What it shows |
|---|---|
| Prism | Visually separates wavelengths into colors |
| Spectrum measurement | Shows relative light distribution across wavelength |
| Human eye | Sees the resulting colors |
| Instrument | Provides a repeatable measurement or spectral curve |
A prism is therefore very useful for demonstrating the principle of dispersion.
A spectrum preview or calibrated spectral measurement can provide more information than a visual prism demonstration. The exact information available depends on the instrument and its supported light-source types.
What Does a Spectral Curve Show?
A spectral curve typically plots:
Wavelength → horizontal axis
and
Relative or measured intensity → vertical axis
The shape of the curve helps describe how the light source distributes its output across different wavelengths.
For example, two lights that both appear white to the eye may have noticeably different spectral distributions.
That is one reason why color appearance alone does not fully describe a light source.
Can Two White Lights Have Different Spectra?
Yes.
Two light sources can appear similar in overall color while producing different combinations of wavelengths.
This is especially relevant for LED lighting, where white light is commonly created using combinations of LED emission and phosphor conversion.
As a result, two white LEDs can have similar correlated color temperature while still having different spectral shapes.
This is also why measurements such as:
CCT
spectral distribution
illuminance
and other light characteristics
should not automatically be treated as interchangeable.
Does a Prism Measure Wavelength?
Not by itself.
A simple prism experiment separates wavelengths spatially, but it does not automatically assign an exact wavelength value to every color you see.
To make quantitative wavelength measurements, a calibrated spectrometer or other spectral measurement system is normally required.
The video therefore demonstrates two levels of observation:
Prism → see the spectrum
Measurement system → characterize the spectrum
What Does the Second Part of the Video Show?
The second part of the video shows a light sensor and a smartphone interface.
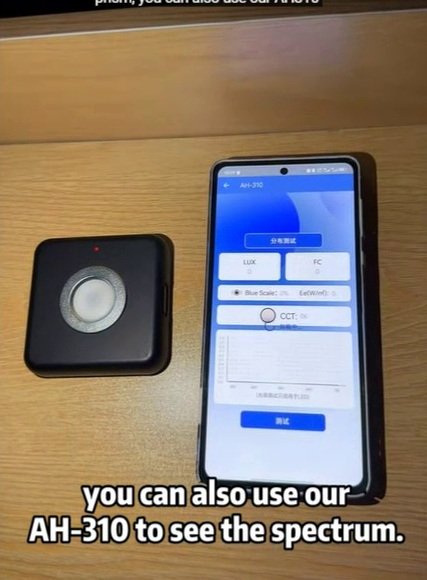
The video text explains:
In addition to using a prism, you can also use our AH-310 to see the spectrum.
The purpose of this section is to show that the spectrum does not have to be viewed only as a projected rainbow.
It can also be represented as a graph, making comparisons between different light sources easier.
Importantly, this short video does not provide calibrated wavelength-by-wavelength numerical data, so no specific spectral values should be inferred from the clip.
Compatibility note: The spectrum-display function shown here should not be interpreted as a universal spectrometer. Spectrum capabilities depend on the sensor, calibration method and supported light-source type. AquaHorti’s current AH-300 spectrum preview is intended for supported phosphor-converted white LEDs rather than every type of lamp.
Why Is a Graph More Useful Than a Prism for Comparing Lights?
A prism is excellent for showing the concept visually.
But if you want to compare two lamps, a graph provides more information.
For example, a measurement can help answer:
- Where is the strongest part of the spectrum?
- Is there a strong blue component?
- How broad is the visible output?
- Do two lights with similar CCT have different spectral distributions?
- Does the spectrum change when the light is dimmed or adjusted?
This makes spectral measurement useful for lighting research, LED evaluation and comparative testing.
What This Experiment Does Not Prove
This video is a simple demonstration rather than a calibrated spectroscopy experiment.
It does not establish exact wavelength values for the projected colors.
It also does not provide enough information to calculate the absolute spectral power distribution of the tested light source.
The visible rainbow depends on factors including:
- light source spectrum
- prism material
- prism angle
- beam geometry
- projection distance
- ambient light
- camera exposure
For precise spectral characterization, calibrated measurement equipment is required.
Related Lighting Measurement Tests
For a real test showing how color-temperature settings can produce different lux readings even when luminous flux is brought close together, see our Does Color Temperature Affect Lux? 2700K vs 5700K LED Test.
For another example involving the blue portion of visible light, see our Computer Monitor Blue Light Test.
You can also see our Smartphone Blue Light Meter Test for another practical visible-light measurement example.
About the Light Measurement System
The video shows an earlier AH-310 light measurement setup being used to display spectral information.
For our current LUX and CCT measurement solution:
Learn more: AH-300 Light Meter – LUX & CCT Measurement
Frequently Asked Questions
Why does a prism make a rainbow?
A prism refracts different wavelengths by slightly different amounts. This separates the wavelengths spatially and produces a visible band of colors.
What wavelength range can humans see?
A commonly cited approximate visible range is 380 to 700 nm, although the exact sensitivity limits of human vision are not sharp boundaries. NASA Science
Is white light made of different colors?
White light can contain many different visible wavelengths. A prism can separate those wavelengths so that they become visible as different colors.
Is a prism the same as a spectrometer?
No. A prism can disperse light into different wavelengths, but a spectrometer adds a detector and calibrated measurement system so the spectral distribution can be measured quantitatively.
Can two white LED lights have different spectra?
Yes. Two lights may appear similar in color or have similar CCT values while having different spectral distributions.
Can a light meter show a spectrum?
A spectrum-capable measurement instrument can display how a light source’s output is distributed across wavelength. The exact capabilities depend on the sensor and instrument design.